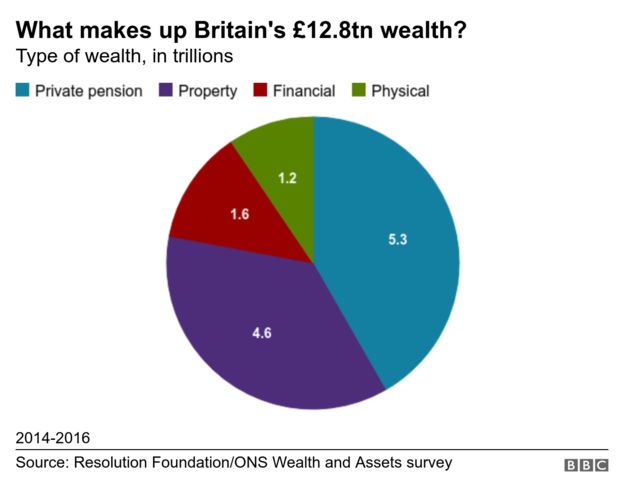
Peoples’ (whole household) wealth is divided into 4 main categories. Obviously there is a broad age range contributing to these figures so the average age of contributors is around 45 years old.
Below is the National domestic household chart which breaks down as follows:-
Private Pensions 41.7% Property 36.3% Financial Wealth 12.6% Physical Wealth 9.4%
 Property includes the Family Home, holiday properties, buy-to-lets etc.
Financial Wealth includes bank accounts, savings accounts, stocks and shares, PEPs, ISAs, TESSAs, life insurance and endowment policies, Business assets, tax liabilities, bank loans, credit cards, monies owed to you in loans, cash in hand etc. (Obviously some of them may represent a negative value.) Your income is included on the Form E but separated out from your Financial Wealth.
Physical Wealth includes all your possessions such as cars, golf clubs, handbags, jewellery, white goods etc.
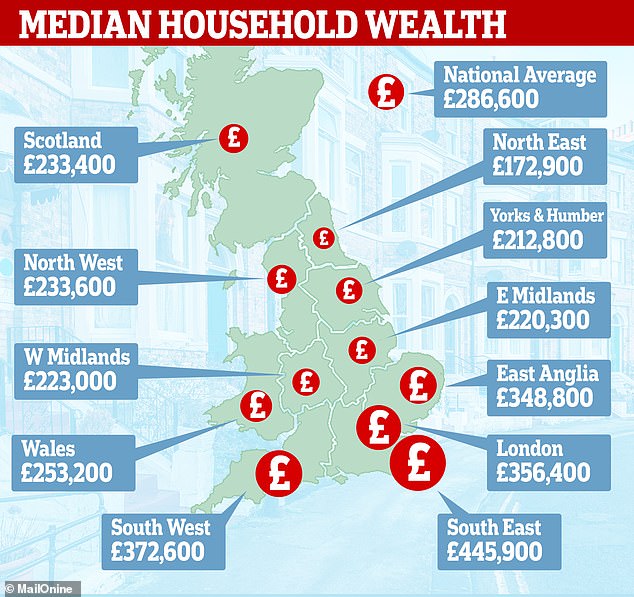
Below are the regional averages, so applying the above percentages to the regional numbers works out as follows: –
(Using the National Average £286,600 and assumes entry on to the property ladder in mid/late 20’s)
Pensions: £119512, Property: £104035, Financial: £36111, Physical: £26940.